
Capital Asset Pricing Model (CAPM)
Would you like to invest your money? Get in touch with an expert:
As a model of the capital market, the Capital Asset Pricing Model (CAPM) can be used to calculate the cost of capital. The model explains the expected return on securities. An expected return is a linear function of the market portfolio's risk premium. All the risks associated with securities on the market are represented by the market portfolio. A key component of the CAPM is beta, which indicates how strongly a particular security responds or correlates with market fluctuations. In general, a security that responds strongly to market fluctuations is riskier, and therefore the expected return is also higher.
More specifically, the
CAPM is used to describe the relationship between systematic risk and the expected return of assets, particularly equities. In the financial world, the CAPM is widely used to evaluate securities and determine the expected returns of assets taking into account the risk of those assets as well as the cost of capital.
Portfolio Theory: Systematic Risk and Unsystematic Risk
Systematic risk is the accumulation of all risks that affect each individual asset within an asset class as a whole. As a result, it excludes the risk that is specific to a single asset. As systematic risks affect the entire asset class, they cannot be reduced, for example, by diversification - spreading the money - within the asset class. To reduce this risk, it is imperative to diversify across a variety of asset classes.
Unsystematic risk refers to the portion of the risk that can be avoided through the diversification of the portfolio of securities.
A Capital Asset Pricing Model (CAPM) is based on the assumption that the risks associated with individual securities may be reduced through the creation of a diversified portfolio, i.e. by using a variety of securities.
Investing involves systematic risks, which are compensated for by a risk premium. In other words, the investor wants to be rewarded for the risks she or he takes.
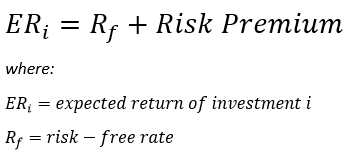
Calculating the risk premium in the CAPM involves calculating the difference between the expected return on the market portfolio and the risk-free interest rate. Risk-free interest rates represent the returns which investors can expect if their money is invested risk-free, also known as time value of money. In this case, the difference in returns is the excess return that could be expected if the money were invested in a market portfolio instead. A risk is taken by the investor in this manner. However, since not every investment reacts equally to market fluctuations, a parameter is needed that takes these fluctuations into account: This parameter is called beta. By assuming a market portfolio represents the market, we are able to convert the expected return of the overall market to the expected return of individual investments. An individual investment's beta indicates how much it fluctuates when the market as a whole increases or decreases.
The formula of the Capital Asset Pricing Model (CAPM) is:
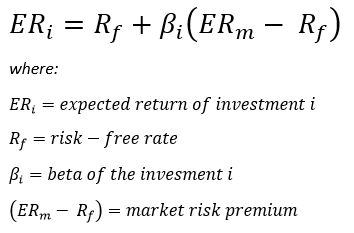
The beta of an investment is a measure of how much risk the investment adds to a portfolio, relative to the market risk. For example, if a stock is riskier than the market, it will have a beta greater than one. In other words, if the market moves by 1%, the stock will move by more than 1%. Stocks with betas less than one are assumed by the formula to reduce portfolio risk. The stock does not rise or fall as much as the market.
The goal of the CAPM formula is to assess whether a stock is fairly valued when its risk and time value of money are compared to its expected return.
Consider the case of an investor, who wishes to buy a stock worth CHF 300. Furthermore, the stock is riskier than the market: this means that its beta is greater than 1. In this example, the beta is 1.2. It is assumed that the risk-free interest rate is 2%. Investors believe that the market will increase by 5% annually.
The CAPM formula can be used to calculate the investor's expected return based on these assumptions. This example shows an expected return of 5.6%.
Expected return = 2 + 1.2 x (5-2)
Expected return = 5.6%
CAPM may also be used for portfolio construction and risk management. Suppose an investor is able to use the CAPM to perfectly optimize the return of a portfolio relative to risk. An investor who is able to accomplish this will have a portfolio that lies on a line that is referred to as the efficiency line or efficient frontier. Among other things, the following graph illustrates this efficiency line:
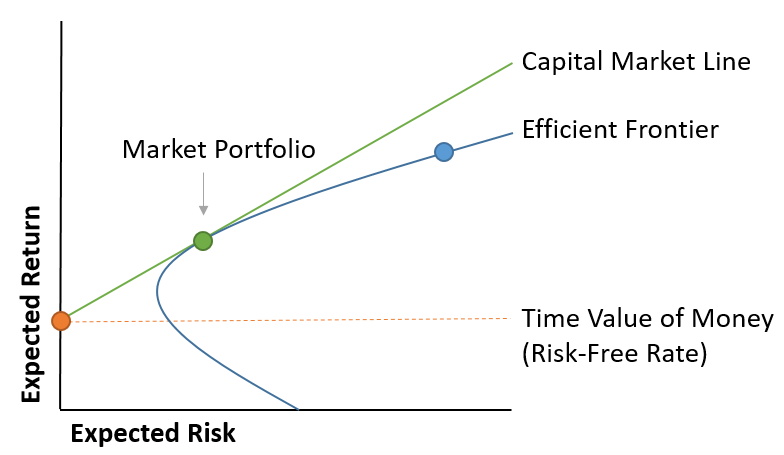
Based on the graph, higher expected returns are associated with higher expected risks. According to modern portfolio theory (MPT), a securities portfolio's expected return increases with increasing risk. Here, we begin by plotting the risk-free interest rate on the y-axis with the expected return, also known as the time value of money. A securities portfolio that lies on the capital market line is therefore preferable to any securities portfolio located to the right of this line. The reason for this is that if there is a parallel deviation to the right, the expected return remains the same but the risk increases. Market portfolios are considered to be the optimal securities portfolio.
It is difficult to determine the capital market line and the efficiency line in practice, but they demonstrate the trade-off between increased return and increased risk. Due to the fact that there is no way to create a portfolio that perfectly matches the capital market line, investors often take on too much risk in order to achieve additional returns. Let us assume that the green dot in the figure represents Portfolio 1, while the blue dot represents Portfolio 2. Let's say Portfolio 1 has an expected return of 5% and a standard deviation (risk) of 7%. Portfolio 2 has an expected return of 7%, but carries a 10% risk. As shown in this example, risk has increased more than return: as a result, an investor is not adequately compensated for the additional risk involved in Portfolio 2.
Similarly to the CAPM, the efficiency frontier can only be calculated theoretically, since it is based on the same assumptions. An efficient frontier portfolio would provide the maximum return for the level of risk it is exposed to. Due to the unpredictability of future returns, it is impossible to determine whether a portfolio is on the efficient frontier or not.
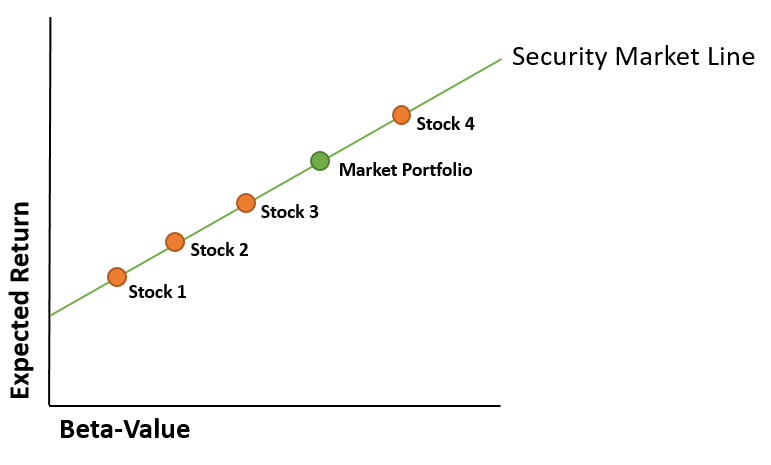
An efficiency frontier chart may also be plotted differently to illustrate the trade-offs associated with individual assets. In this case, the beta is plotted on the x-axis. The capital market line is now referred to as the security line - better known as the security market line (SML). An increase in the beta will result in an increase in the expected return. There is a greater risk associated with a higher beta. There may be a point where a portfolio of high-beta stocks falls somewhere along the capital market line in which the trade-off is acceptable - even if it does not represent the ideal portfolio in theory. Unfortunately, to determine beta it is also necessary to make assumptions. In light of the fact that these assumptions are not necessarily true, the model loses its relevance.
There is no easy way to construct an ideal portfolio that matches an individual's risk tolerance and risk appetite. To be able to make an informed decision on this matter, it is advisable to consult an expert, such as an independent wealth manager.
As with most models, the CAPM formula relies on several assumptions that may not be realistic. There are two general assumptions that are made in modern financial market theory.
- Securities markets are assumed to be competitive and efficient. Thus, relevant information about companies is disseminated and absorbed quickly and is therefore already included in the price.
- Investors are assumed to be rational, risk-averse and seeking to maximize their returns.
By including beta in the formula, we are assuming that risk can be measured by the price volatility of a stock. It should be noted, however, that price movements in either direction are not equally risky. The time period in the past that is used to determine the volatility of a stock is not standardized because stock returns and risk are not normally distributed.
The market portfolio used to determine the market risk premium is only a theoretical value and not an asset that can be purchased or invested in as an alternative to stock. In most cases, investors replace the market with a large stock index, which is not a perfect comparison.
Additionally, the CAPM assumes that future cash flows can be estimated for the discounting process, which is not true, resulting in the CAPM becoming redundant. Furthermore, risk-free rates may not be constant. There is the possibility, that these rates fluctuate during the discounting period. As a result, there can be no measurement of expected returns. Expected values are derived only from a sample of past data. We do not know what the "true" expected value is. Consequently, it is necessary to recognize that an expected return is only an estimate.
Would you like to invest your money?
Speak to an expert.
Your first appointment is free of charge.