
Gini Index
Would you like to invest your money? Get in touch with an expert:
What is the Gini Index?
The Gini index is a metric indicating income inequality within a population. Ranging from 0 to 1, the Gini index ascends with increased income inequality among the population. A value of 0 signifies perfect equality, wherein all inhabitants possess identical income. Conversely, a value of 1 signifies perfect inequality, denoting a scenario where a sole individual earns the entire income while all other inhabitants earn nothing. Conceived by Italian statistician Corrado Gini in 1912, this coefficient evaluates not only income distribution but also wealth distribution within a population. Gini indices for wealth tend to be notably higher than those for income.
It is important to note that while the Gini index assesses income distribution, it
does not capture the absolute income levels within a country. Consequently, a nation with very low income levels might exhibit the same Gini index as a nation with considerably higher income levels.
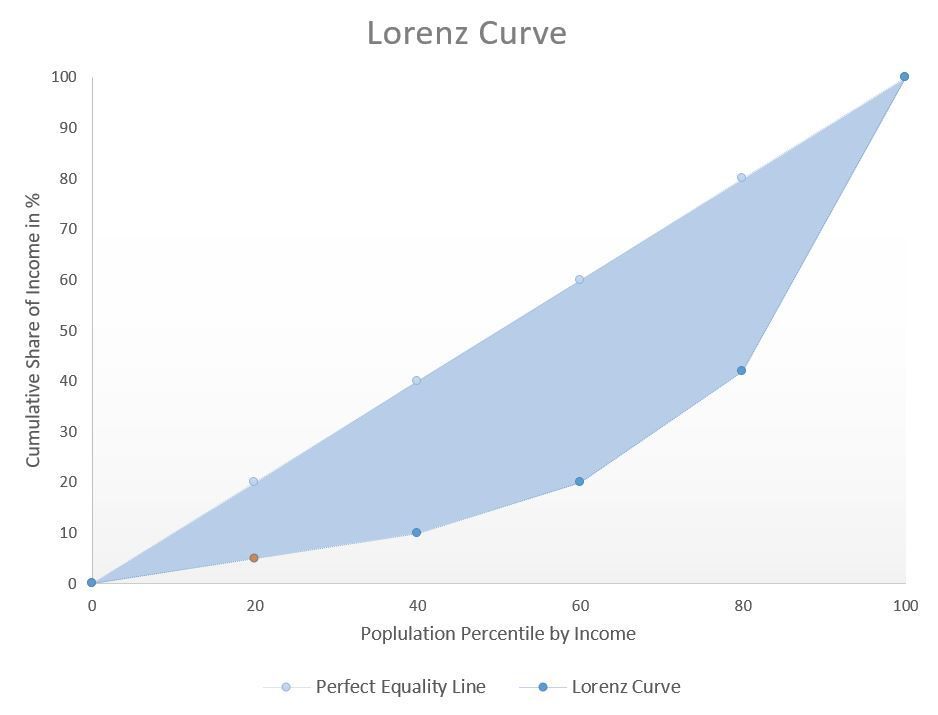
The Lorenz curve is a visual representation of the distribution of income, and therefore the Gini index. It shows population percentiles by income on the horizontal axis, starting with the lowest income group. The vertical axis plots cumulative income.
The figure below depicts a Lorenz curve. The further the curve deviates from the line of perfect equality, the greater the observed inequality. For example, the orange point on the Lorenz curve is interpreted as follows: the poorest 20% of the population possess 5% of the total income. In a scenario of absolute equality, this group would possess 20% of the total income. In this illustration, the bottom 40% of the population accounts for 10% of the total income, and so forth.
The total inequality is represented by the area below the diagonal line from bottom-left to top-right. This diagonal line signifies the line of perfect equality, dividing the diagram at 0.5. The Gini index is computed by subtracting the area under the line of perfect equality (0.5) from the area under the Lorenz curve. This computation yields the area between the line of perfect equality and the Lorenz curve, which signifies inequality (blue marked area). This area between the two lines is also termed the concentration area, illustrating the income concentration within a population.
The computation of the Gini index relies heavily on accurate data regarding a nation's gross domestic product (GDP) and income. Shadow economies and informal economic activities are prevalent across all countries. Particularly in developing nations and at the lower strata of income distribution within countries, informal economic activities tend to constitute a substantial portion of actual economic production. In both scenarios, this implies that the Gini index derived from measured incomes exaggerates the true income inequality. Precise data on wealth face even greater challenges due to the prevalence of tax havens, making accurate measurements more elusive.
Furthermore,
diverse income distributions can yield the same Gini index. While the Gini index quantifies a two-dimensional area, it does not expound on the shape of this area. In contrast, the Lorenz curve offers more comprehensive insights. Nonetheless, the Lorenz curve also exhibits
limitations regarding its informative capacity. For instance, it does not account for demographic differences such as age and gender. A higher proportion of retirees can influence a higher Gini index, an aspect not captured by the curve.
Switzerland recorded a Gini index of 0.43 in 2021 for pre-tax and pre-social security incomes, maintaining a consistent range over recent decades. However, when factoring in disposable income, the Gini index decreases to 0.29. This indicates a reduction in inequality due to the influence of tax and social security systems. Compared to European nations, Switzerland falls within the middle range. Scandinavian countries exhibit more uniform wage distributions, while Italy, Spain, and Portugal demonstrate higher levels of inequality.
Switzerland faces higher levels of inequality in the distribution of wealth. In 2015, the wealth Gini index reached 0.86, primarily due to approximately a quarter of households owning no wealth and about a third possessing wealth below CHF 50,000. The top 1% holds around 40% of the total wealth. Nonetheless, wealth concentration diminishes when considering pension provisions.
Would you like to invest your money?
Speak to an expert.
Your first appointment is free of charge.