
Sharpe-Ratio
Would you like to invest your money? Get in touch with an expert:
What is the Sharpe Ratio?
The Sharpe Ratio serves as a metric to evaluate an investment's performance concerning its risk exposure. This ratio assesses the excess return of an investment in relation to its risk level, measured by the standard deviation that reflects price fluctuations in an asset or portfolio. Essentially, the Sharpe Ratio quantifies a portfolio's performance while factoring in additional risks, facilitating comparisons between high-risk and lower-risk investments. It's important to note that the Sharpe Ratio's main limitation stems from assuming that investment returns follow a normal distribution.
Considered one of the most prevalent methods for computing risk-adjusted returns, the Sharpe Ratio aligns with the principles of Modern Portfolio Theory (MPT). MPT suggests that diversifying a portfolio by adding assets with minimal correlations can reduce portfolio risk without sacrificing returns. This ratio can be computed using either historical returns (ex-post) or anticipated returns (ex-ante).
The Formula for Calculating the Sharpe Ratio
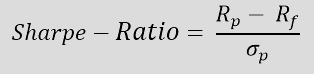
Rp = Portfolio Return
Rf = Annualized Risk-Free Return
σp
= Standard Deviation of Portfolio Return
The numerator calculates the excess return. It's derived by subtracting the risk-free annualized return (Rf) — for instance, a secure money market investment — from the portfolio's annualized return (Rp). The risk-free return represents the return on an investment without any associated risk. The excess return is related to the standard deviation of the portfolio's excess return (σp). The standard deviation indicates the extent to which the portfolio's return deviates from the expected return.
Examples for Calculating the Sharpe Ratio
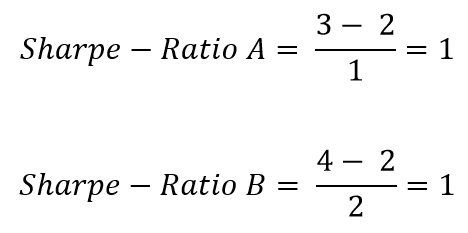
Example 1
An investor would like to compare two equity funds. The wealth manager compares the returns of the equity funds using the Sharpe Ratio. Both funds have a risk-free interest rate of 2%.
Equity Fund 1: Within a year, Equity Fund 1 yields a return of 3%. The standard deviation of Equity Fund 1 is 1%.
Equity Fund 2: Within a year, Equity Fund 2 yields a return of 4%. The standard deviation of Equity Fund 2 is 2%.
In a direct comparison, Equity Fund 2 earns a higher return than Equity Fund 1. However, upon calculating the Sharpe Ratio, it becomes evident that both funds, after adjusting for risk, are equally attractive.
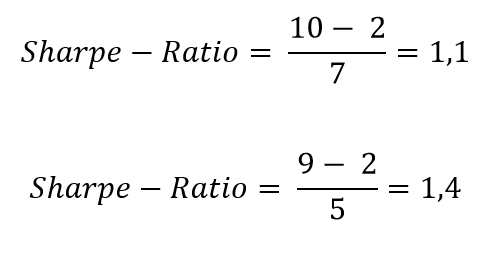
Example 2
An investor wishes to add a new asset class to their portfolio. A wealth manager is advising them on this decision.
The portfolio, comprising stocks and bonds, yielded a return of 10% last year. The consideration is to add a fund to the portfolio. The current risk-free interest rate is 2%. Without the fund, the standard deviation of the portfolio, consisting of stocks and bonds, is 7%.
The wealth manager explains that incorporating the fund into the portfolio will lower the portfolio's anticipated return to 9%. However, simultaneously, it will decrease the portfolio's standard deviation to 5%.
While the investment in the fund diminishes the portfolio's absolute return, a higher Sharpe Ratio is calculated. The Sharpe Ratio increases from 1.1 to 1.4. This implies that the return, accounting for risk, is superior.
Limits of the Sharpe Ratio
The Sharpe Ratio employs the standard deviation of returns in the denominator as an estimate of the overall portfolio risk, assuming that returns follow a normal distribution. This presupposes that a large portion of events, in this case returns, falls within a specific range. Additionally, the standard deviation assumes that price movements in both directions carry equal risk. However, this does not align with reality. The returns in financial markets deviate from the average due to a large number of unexpected price declines or peaks.
Moreover, the reasons behind a good return cannot be captured. It can only measure that the past return was good,
without determining the reasons behind it. Furthermore, the analysis does not categorize risks into systematic and unsystematic risks. Systematic risks affect all types of investments, while unsystematic risks pertain specifically to an investment. The Sharpe Ratio can be partially manipulated. For instance, extending the measurement interval can lower the estimation of the standard deviation.
Would you like to invest your money?
Speak to an expert.
Your first appointment is free of charge.