
Supply
Would you like to invest your money? Get in touch with an expert:
What is Supply?
Generally, supply refers to the total number of goods or services available to customers. You can think of supply as the number of things available at a particular price. The supply of a good or service at a particular price is closely related to the demand. Since every firm wants to maximize profits, producer supply will increase when the price goes up (if all else is equal). When customers are willing to pay more for a good or service, producers will increase production. A higher supply will lead to a lower price, when demand remains the same. Equilibrium in a market occurs when supply and demand are equal. The market equilibrium maximizes profits for producers and benefits for consumers.
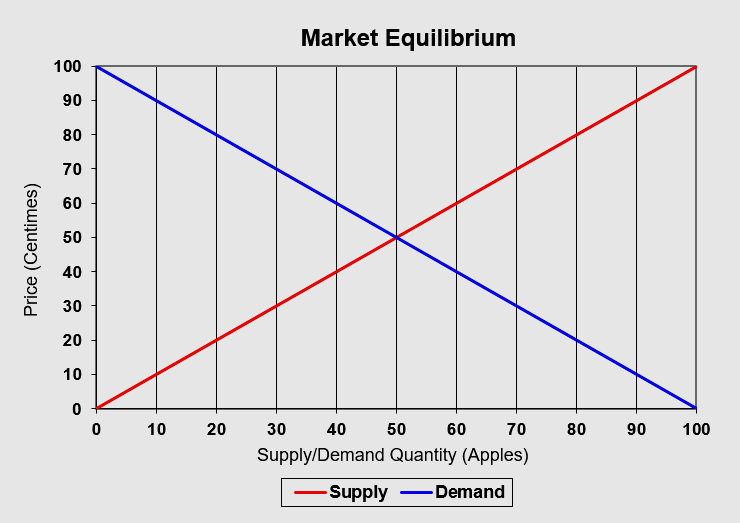
Most of the time, supply and demand are determined by a lot of factors and can be represented by curves. These curves are called supply and demand curves. The vertical axis shows the price, and the horizontal axis shows the quantity sold. A demand curve therefore runs downwards, from left to right. Customers won't buy products/services at a very high price. They will be more likely to purchase a product or service when it becomes cheaper. The supply curve is rising. It is common for sellers to offer more of a product or service when prices increase. Market equilibrium is defined as the intersection of the supply and demand curve.
The Calculation of the Equilibrium Price
Supply
Suppose that 100 apples are offered on the market for a price of one franc per apple. Each time the price of apples decreases by 10 centimes, the supply of apples decreases by 10 apples, because some farmers are no longer willing to sell their apples at this price. In terms of a function, this can be represented as follows:
Supply Quantity = 100 x Price (in CHF)
Demand
Suppose the customers at the weekly market are unwilling to pay one franc per apple. Therefore, if the price is one franc, no apple will be sold. Nevertheless, as the price falls, there is an increasing number of customers who are willing to buy an apple. As a result, the quantity of apples sold increases as the price falls. Suppose there are 10 people willing to buy an apple for 90 centimes, so 10 apples are sold for 90 centimes. A function can also be used to represent the demand:
Demand Quantity = 100 - (100 x Price (in CHF))
By equating these two functions, the equilibrium price can be calculated. As shown in the figure, the equilibrium price in this example is 50 centimes.
Share prices are also calculated based on buy and sell orders. Therefore, pricing is determined by supply and demand.
The order book determines the share price. An order book compares the number of sell offers (ask volume) and the number of buy offers (bid volume) for each share at a specific price. These price settings are referred to as limits and are entered by investors, for example, as limit orders. To trade shares, there has to be a sell and a buy offer at the same price. Typically, this occurs when there is a limit order containing the same bid (buy) and ask (sell) price. There is also the option of entering a market order, in which the seller or buyer is prepared to sell at the current bid price or to buy at the current ask price. Price charts of shares reflect the price that is ultimately determined by supply and demand. Therefore, the prices represent the equilibrium of the market. In the chart, we can see the order book for Nestlé's shares at 9:09 a.m. on September 10, 2021 (snapshot). There is a continuous adjustment of the price. Above the equilibrium price (represented by the blue line in the figure), you can see the sell offers by quantity and price. Below the equilibrium price, buy offers are listed by price and quantity.
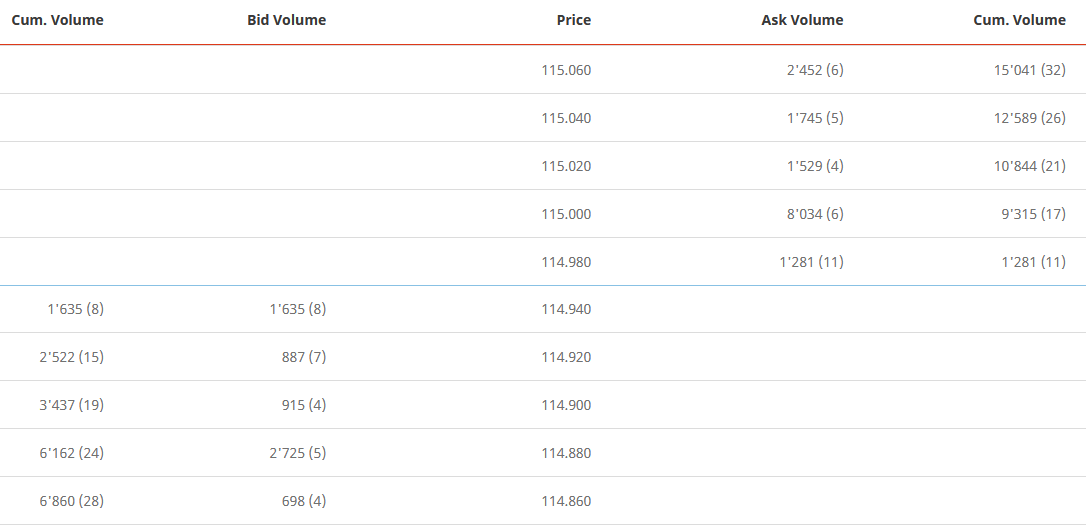
Nestlé Share Order Book on 09/10/2021 9:09 a.m. , www.six-group.com
For example, a buyer who enters a market order for 2,000 Nestlé shares will get the first 1,281 shares for CHF 114.98 (the ask price and the volume at this price). In addition, he receives the remaining 719 Nestlé shares for CHF 115. Thus, the seller sells all of the 1,281 Nestlé shares he offered at CHF 114.98. At the price of CHF 115, the seller sells only 719 Nestlé shares out of the total 8,034 Nestlé shares offered.
If a seller enters a market order for 2,000 Nestlé shares, he sells the first 1,635 shares for CHF 114.94 (bid price and bid volume at this price). The remaining 365 shares are sold for CHF 114.92. The buyer who placed a bid of CHF 114.94 receives all 1,635 Nestlé shares that he desired. In this trade, the buyer who bid CHF 114.92 receives only 365 shares from the original target of 887 shares.
For liquid securities, this process is repeated continuously with every new order, and the order book therefore changes every minute, every second, or even every fraction of a second.
Supply Elasticity
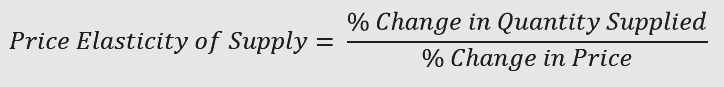
In economics, supply elasticity is how a good or service responds to price changes. In general, when the price increases, the supply increases as well.
Profits from goods and services do not remain constant over time. There are many factors that influence them, such as competition. Therefore, companies focus on products that are profitable. The supply of highly valued goods increases, while the supply of low-valued goods decreases.
Supply elasticity may also be affected by factors such as the capacity of an industry and its ability to increase or decrease production. An industry's stock, inventory, or raw material level also plays a role in supply elasticity. Additionally, the amount of time it takes to produce a good, as well as the availability of labor and capital, affect the quantity of supply. Often, short-term supply is not elastic because producers are operating at capacity. Firms can only adjust to increased demand over the long term. Companies strive to adapt to demand more quickly, for example, by improving their technology and capacity (increasing their inventory). Furthermore, improving the manner in which products are shipped and distributed can be beneficial.
Markets can also be considered relatively inelastic. It is common for these markets to be less liquid. This includes, for example, the real estate market, since resources such as land are limited. The production period of houses, for example, is very long. Therefore, reacting to price changes is only possible with a long time lag.
Shares with a high degree of supply elasticity are more volatile. Low supply elasticity shares are less volatile. Due to the limited supply of shares (low supply elasticity), the shares may be highly valuable as a result of their limited supply. Bid prices usually rise in a liquid market until there are sellers willing to sell their shares at these prices.
Would you like to invest your money?
Speak to an expert.
Your first appointment is free of charge.