
Demand
Would you like to invest your money? Get in touch with an expert:
What is Demand?
Demand can be defined as the willingness of a customer to pay a particular price for a particular product or service. Assuming that all factors remain constant, a price reduction will result in an increase in demand. In an economy, demand can be defined as either the market demand for a particular good or service, or the aggregate demand for all goods. Aggregate demand represents the demand for goods and services aggregated across an entire economy. By comparing demand with supply, it is possible to determine the price of a particular good or service and the quantity of that good or service purchased at that price.
Companies invest considerable resources in determining the demand for their products. By analyzing demand, they can estimate how much product they can sell at a particular price. There is a strong interdependence between demand and supply. The customer is looking for the lowest possible price for a product or service. In contrast, the company is attempting to maximize its profit by selling the product at the highest price possible. If the company asks too much money for a product or service, fewer customers will be willing to buy the product or service at that price. Therefore, demand decreases. There is a likelihood that demand for a company's products will exceed supply when the price is too low.
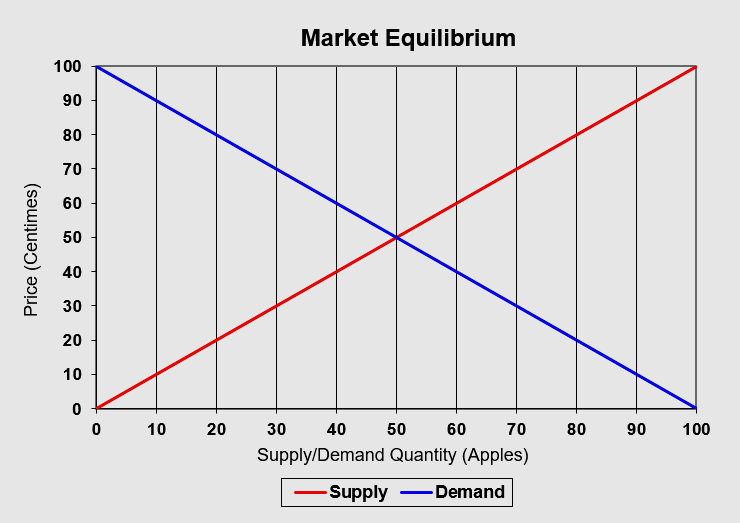
Most of the time, supply and demand are determined by a lot of factors and can be represented by curves. These curves are called
supply and demand curves. The vertical axis shows the price, and the horizontal axis shows the quantity sold. A
demand curve therefore runs downwards, from left to right. Customers won't buy products/services at a very high price. They will be more likely to purchase a product or service when it becomes cheaper.
The supply curve is rising. It is common for sellers to offer more of a product or service when prices increase. Market equilibrium is defined as the intersection of the supply and demand curve.
The Calculation of the Equilibrium Price
Supply
Suppose that 100 apples are offered on the market for a price of one franc per apple. Each time the price of apples decreases by 10 centimes, the supply of apples decreases by 10 apples, because some farmers are no longer willing to sell their apples at this price. In terms of a function, this can be represented as follows:
Supply Quantity = 100 x Price (in CHF)
Demand
Suppose the customers at the weekly market are unwilling to pay one franc per apple. Therefore, if the price is one franc, no apple will be sold. Nevertheless, as the price falls, there is an increasing number of customers who are willing to buy an apple. As a result, the quantity of apples sold increases as the price falls. Suppose there are 10 people willing to buy an apple for 90 centimes, so 10 apples are sold for 90 centimes. A function can also be used to represent the demand:
Demand Quantity = 100 - (100 x Price (in CHF))
By equating these two functions, the equilibrium price can be calculated. As shown in the figure, the equilibrium price in this example is 50 centimes.
Macroeconomic Policy and Demand
The Swiss National Bank (SNB) is responsible for ensuring price stability, taking into account economic developments. Therefore, the SNB is able to influence liquidity on the money markets, which has an impact on interest rates. A very low interest rate leads to excess demand for goods and services. This can cause bottlenecks in the long run, resulting in an increase in prices. A high interest rate leads to low aggregate demand, which in turn lowers consumer prices (inflation is dampened). Additionally, the appreciation of the Swiss franc may have a lowering effect on prices.
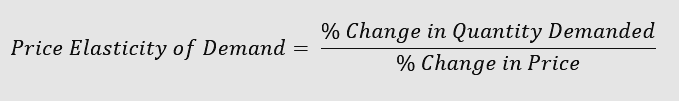
Elasticity of Demand
Demand elasticity is how much the quantity demanded changes when the price changes. There are different elasticities for different goods. Fuel prices, for example, are very inelastic, as motorists do not adjust their fuel consumption in response to small price changes. Luxury goods, such as jewelry, are very elastic. It is generally considered that luxury goods are items that consumers can live without more easily. Companies are interested in knowing the elasticity of their products. Products that are not easily interchangeable and that have an advantage over comparable products are less elastic in demand.
There is also a price elasticity of demand for stocks. A stock with a high price elasticity of demand is more volatile. In other words, stocks are more susceptible to changes in the business cycle. If demand elasticity is low, the stock will be less volatile. Stocks with low volatility are those in the utilities, telecoms, and non-cyclical consumer goods.
Share prices are also calculated based on buy and sell orders. Therefore, pricing is determined by supply and demand.
The order book determines the share price. An order book compares the number of sell offers (ask volume) and the number of buy offers (bid volume) for each share at a specific price. These price settings are referred to as limits and are entered by investors, for example, as limit orders. To trade shares, there has to be a sell and a buy offer at the same price. Typically, this occurs when there is a limit order containing the same bid (buy) and ask (sell) price. There is also the option of entering a market order, in which the seller or buyer is prepared to sell at the current bid price or to buy at the current ask price. Price charts of shares reflect the price that is ultimately determined by supply and demand. Therefore, the prices represent the equilibrium of the market. In the chart, we can see the order book for Nestlé's shares at 9:09 a.m. on September 10, 2021 (snapshot). There is a continuous adjustment of the price. Above the equilibrium price (represented by the blue line in the figure), you can see the sell offers by quantity and price. Below the equilibrium price, buy offers are listed by price and quantity.
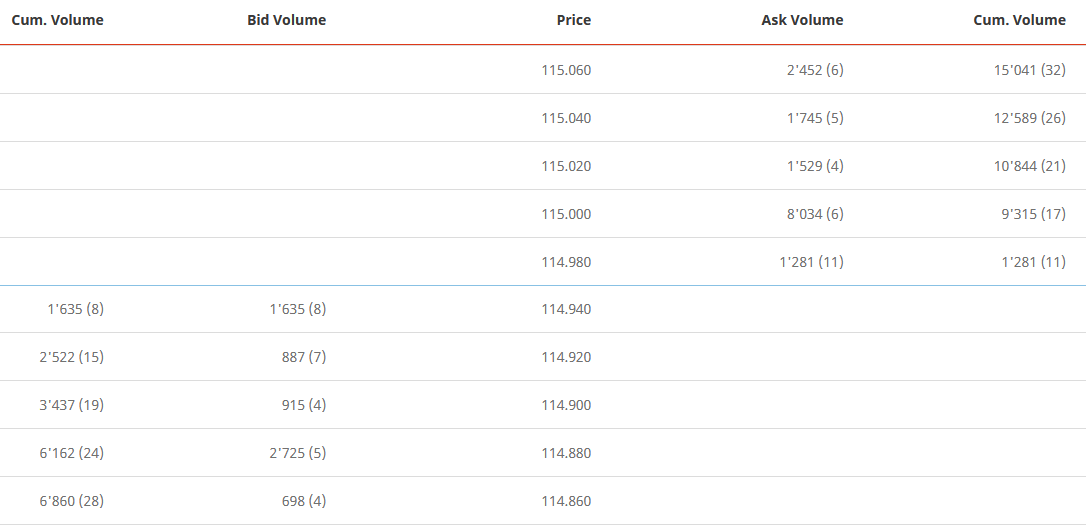
Nestlé Share Order Book on 09/10/2021 9:09 a.m. , www.six-group.com
For example, a buyer who enters a market order for 2,000 Nestlé shares will get the first 1,281 shares for CHF 114.98 (the ask price and the volume at this price). In addition, he receives the remaining 719 Nestlé shares for CHF 115. Thus, the seller sells all of the 1,281 Nestlé shares he offered at CHF 114.98. At the price of CHF 115, the seller sells only 719 Nestlé shares out of the total 8,034 Nestlé shares offered.
If a seller enters a market order for 2,000 Nestlé shares, he sells the first 1,635 shares for CHF 114.94 (bid price and bid volume at this price). The remaining 365 shares are sold for CHF 114.92. The buyer who placed a bid of CHF 114.94 receives all 1,635 Nestlé shares that he desired. In this trade, the buyer who bid CHF 114.92 receives only 365 shares from the original target of 887 shares.
For liquid securities, this process is repeated continuously with every new order, and the order book therefore changes every minute, every second, or even every fraction of a second.
Would you like to invest your money?
Speak to an expert.
Your first appointment is free of charge.