
125/250d Adjusted Slope Momentum
Would you like to invest your money? Get in touch with an expert:
The 125/250d Adjusted Slope Momentum strategy was developed by hedge fund manager Andreas F. Clenow. The 125/250d Adjusted Slope Momentum is a momentum indicator. The strategy is explained below in an easy-to-understand manner. Further details can be found in the book by Andreas F. Clenow - Stocks on the Move: Beating the Market with Hedge Fund Momentum Strategies.
A momentum strategy seeks to profit from a continuing market trend. Generally, momentum strategies use technical indicators to determine when to enter or exit an investment/market. The 125/250d Adjusted Slope is such a technical indicator.
Basically, momentum investing involves buying
stocks (or other
financial instruments) if the
price is increasing (long: buying stocks). In a
downward trending market, a short position is taken (short: selling the stock). The investment strategy is based on the idea that a trend will last for a certain period of time and a
return can be generated from this trend.
Momentum-Indicators
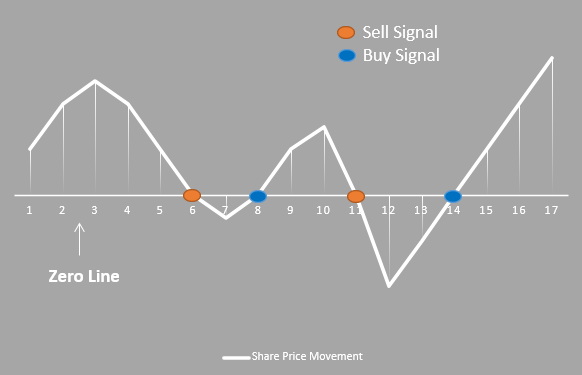
Investors, who use momentum strategies, use technical indicators to decide when to buy and sell securities. A price movement's momentum is shown in the figure below. As an example of calculating momentum, the current price can be set relative to the average price level of the past year. It is common to choose a certain period of time, such as 3, 6 or even 12 months. The process is repeated several times, which leads to the share-price-movement-line in the figure. The price is above the zero line, if it is higher than the average price over the selected period in the past. Values below the zero line are those when the price is lower than the average over the selected period in the past. In accordance with this strategy, a share should be sold as soon as its value falls below the zero line. The share should be bought if the value rises above the zero line.
Source: based on www.comdirect.de
Some momentum investors use indicators such as moving averages (MA). The strategy is accomplished by using two longer-term moving averages, for example, a 50-day MA and a 200-day MA. If the 50-day MA exceeds the 200-day MA, then a buy signal is generated. If the 50-day MA is below the 200-day MA, then a sell signal is generated.
Other momentum strategies involve cross-investment analysis. For example, some momentum investors analyze the government bond yield curve. A 10-year government bond yield exceeding a 2-year government bond yield, for example, is usually a buy signal, and a 2-year government bond yield exceeding a 10-year government bond yield is generally a sell signal. In particular, comparing 2-year and 10-year government bond yields is a good indicator of recessions. A recession often occurred when the 2-year government bond yield was higher than the 10-year government bond yield in the past (inverted yield curve). It is also possible for such indicators to affect the stock market. In order to make informed investment decisions, a good wealth manager takes into consideration these factors.
There are also other strategies that consider both, momentum indicators and fundamental factors. One such system is the CAN SLIM. This strategy focuses on quarterly and annual earnings per share (EPS). The investor generally seeks stocks with both, earnings and sales momentum, as well as stocks with price momentum.
Digression: CAN SLIM
CAN SLIM is an acronym. When a stock is about to increase substantially in value, it shows the following seven characteristics:
- C = Current quarterly earnings – Quarterly earnings should be approx. 20% higher than in the previous year.
- A = Annual earnings growth – The growth rate (3 years) should be more than 25% and the ROE should be higher than 17%.
- N = New product or service – The company should have a certain level of innovation.
- S = Supply and demand – When prices are rising, the trading volume should still be high.
- L = Leader or laggard - High ROE, profit margins, and dynamic price development characterize market leaders.
- I = Institutional sponsorship - It could be a sign of sustainable growth if institutional investors support the price development with high investment amounts.
- M =
Market direction – Overall, the market should perform well.
Understanding the 125/250d Adjusted Slope Momentum-Indicator
As a momentum indicator, the 125/250d Adjusted Slope calculates the average annual slope of a stock's price over the last 125 and 250 trading days. The 125/250d Adjusted Slope is therefore a method that calculates the average of the adjusted 125-day and 250-day slope values.
As a result of using the average, unusually large movements in the share price are smoothed out. It is essential to smooth the price, because many price movements are based on extraordinary events, such as announcements of takeovers and positive or negative surprises in quarterly, half-yearly, and annual numbers. A momentum investor, however, would not be interested in these price movements. 125/250d Adjusted Slope Momentum adjusts and smooths extreme price movements. Therefore, volatility has been adjusted in the momentum indicator. Hence, it only displays the trend of a stock's price. Buy or sell decisions are ultimately determined by this trend.
An investment universe must be defined in order to apply the strategy. Therefore, it is necessary to select and analyze stocks or financial instruments. During this selection process, momentum investors already follow certain rules. For example, they select only stocks from certain industries, with a certain market value, with a certain number of outstanding shares, with a good turnover, with a certain free cash flow, or based on other characteristics.
The 125/250d Adjusted Slope is calculated for all stocks for each month - or another specified time period - after selecting the investment universe. The companies are then ranked based on the 125/250d Adjusted Slope Momentum (best smoothed upward movement of the stock price). Using this list, the portfolio's stock selection is determined. For the selection, further rules are defined. As an example, a portfolio could only contain stocks with a 125/250d Adjusted Slope Momentum, which is higher than 35.
It requires expertise to implement momentum strategies correctly, and they are generally complex and time-consuming. For this reason, consulting an expert such as an independent wealth manager may be beneficial. To choose the best value stocks from the investment universe of value stocks, Estoppey Value Investments uses the 125/250d Adjusted Slope Momentum.
Would you like to invest your money?
Speak to an expert.
Your first appointment is free of charge.